
2027 NFL Draft Offensive Tackle Rankings - 49-53
| # | Player | Pos | H/W/S | Team | Weight | Height | 40YD | AVG POS RANK | AVG OVR RANK | Rating | Summary |
|---|---|---|---|---|---|---|---|---|---|---|---|
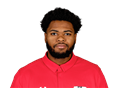
49 |
|
6-5
300lbs
5.23
|
OT |

|
300lbs | 6-5 | 5.23 | 147 | 778 |
66.4
|
Sales is a seasoned, technically sound tackle who turned into an FCS standout at Austin Peay. He protects well, with a single sack allowed... |
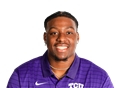
50 |
|
6-6
320lbs
5.22
|
OT |

|
320lbs | 6-6 | 5.22 | 82 | 434.5 |
65.9
|
Taylor-Whitfield is a durable, seasoned lineman with starts at three spots for TCU. He has anchored the left side for two years and has the... |
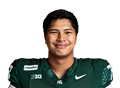
51 |
|
6-4
308lbs
5.11
|
OT |

|
308lbs | 6-4 | 5.11 | 93 | 495 |
64.3
|
Young is an athletic young tackle who started five games for Michigan State in 2025. He moves well and closed that season as the starter at... |
52 |

|
6-5
340lbs
5.40
|
OT |

|
340lbs | 6-5 | 5.40 | 132 | 701 |
62.4
|
A two-month audition is the whole evaluation. Babalade opened 2025 as a backup, inherited the right tackle job when injury struck the... |
53 |

|
6-8
310lbs
5.30
|
OT |

|
310lbs | 6-8 | 5.30 | 156 | 846 |
59.7
|
Gentry is an experienced, respected tackle who has started for BYU and was on Michigan's national championship roster. He allowed one sack... |